
High water costs and pressure from water quality regulators are forcing nursery growers to achieve high irrigation efficiency to save water and produce less runoff.

Available water
A key piece of information to manage irrigation in containers is understanding how much plant-available water a substrate can hold. This is determined by irrigating pots thoroughly and weighing them after drainage has stopped. Then the plants are left without irrigation until visible signs of wilting develops (which could take as long as a week or two depending on weather conditions) and they are weighed again. The difference in weight represents the amount of water that has left the container by evapotranspiration and is called plant-available water. The density of water (1 g/cm3) is used to convert the measured weight to the volume of water that left the pot. When half of the plant available water is depleted, irrigation should be applied. Although using half of available water to determine when to irrigate is simple, substrates may vary in the percentage of easily available water and additional research can provide more accurate determination of easily available water.
The volume of water held by a substrate at a point in time is called volumetric water content (commonly abbreviated as VWC) and is expressed as a percentage of the volume of the whole pot. For example, a 1-gal1 pot that contains twenty ounces of water is at 20/128=0.16 or 16% volumetric water content. A typical substrate used in ornamental production may have a VWC of 60% right after irrigation and of 25% when the plant wilts. In this case the available water would be 35% (60%-25%) and the easily available water = 17.5%.

Tension
Determining the volume of water held at different tensions in the substrate can provide more clarity about available water. Tension is the opposite of pressure and is measured in kPa or cbars and these units are equivalent. Here we are in the realm of the forces that hold water in a porous material, such as an organic container substrate. These forces are called capillary forces and they are stronger when the pores are smaller. Porous materials typically have a range of pore sizes and the larger pores empty when smaller forces are applied to them. There are some pores that are so large that they cannot even hold water against its weight, and these are the pores that generate leachate right after an irrigation. These pores are so large and their capillary forces so weak, that the water runs right through them. Medium-sized pores are stronger, holding some water against gravity. However, these medium-sized pores are holding water with low tension and will be the first for plant roots to empty when the forces generated by transpiration pulls water through the plant vascular system. The greater the tension, the less water is in the substrate and generally the less happy a plant would be. Plants physiologically respond to tension, not volumetric water content. A plant will grow in a substrate at 5 kPa that has 30% volumetric water content just as well as in another substrate also at 5 kPa but with 45% volumetric water content. Tension can be considered as a measure of “water stress” for the plant.

Water retention curves
As more water is used by the plant and more pores drain, the volumetric water content decreases and the tension at which water is held in the substrate increases, since the pores that still contain water get smaller and smaller. To get the full picture, volumetric water content is plotted on the y-axis and the tension on the x-axis. This curve is kind of a signature of the water behavior of a substrate and is called a “water-retention curve” or “moisture-release curve” (Figure 1). With container substrates, this curve is very steep initially, meaning that the substrate is giving up a lot of water with minimal change in tension. This is the best bang for the buck, water is easily extracted and within this range is where we want to keep water content to minimize water stress. This also explains why we irrigate when half of plant available water is expended, the initial half is known as “easily available water” because it is held in larger pores at low tension. In this range, the substrate is releasing a lot of water without stressing plants. As the volumetric water content decreases, the steepness of the curve also decreases. Here we are in the territory where the relationship between volumetric water content and tension becomes unfavorable and water stress may occur. A flatter curve means a large change in tension (a lot of stress) for little water taken up by plants. The shape of this curve also explains why being one day late in watering my plants at home does not seem to matter at all. I am in the steep portion of the curve and the tension changes a little, but if I don’t water it for a couple of days, one additional day of delay can have quite dramatic results. If I forget to water it for one day in the steep zone, I may lose 5% of water content that corresponds to only 1 kPa. If I do the same in the flat zone, I may get a change of 15 kPa. The greatest tension thresholds to achieve high yields are known for some crops. For ornamentals we do not have this luxury, but generally plants in pots are kept at tensions in the order of 5 kPa and this is a result of the soilless substrate we grow plants in; substrates allow for very moderate tensions compared to crops grown in mineral soils, like berries and vegetables (that may be kept at 10 to 30 kPa) and even more compared to trees (easily in the order of 100 to 2000 kPa). In Figure 1, you can tell that the steeper portion of the curve is below 5 kPa.

How to obtain retention curves
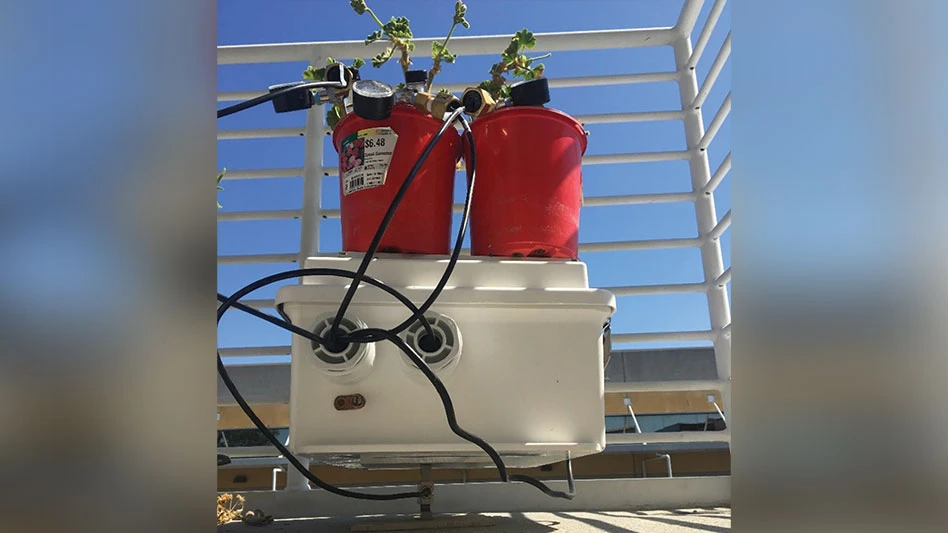
Tension can be measured with a simple device called a tensiometer. The instrument is a plastic tube filled with water with a porous cup that allows the water inside to attain hydraulic equilibrium with the water in the substrate pores. A vacuum gauge on the tensiometer measures the same tension as experienced by the plant roots. A pressure transducer installed in the tensiometer can enable it to be connected it to a data logger and the tension can be recorded over time. Volumetric water content can be measured with sensors and probes, but the easiest way is just to weigh the pot often to determine the change in water volume. In this study, we used a balance connected to a data logger to measure weight and tensiometers to measure tension until the substrate dried completely. Figure 2 shows the weight of the pot during a dry-down cycle. Notice that very little water is lost at night, but significant amounts are lost during the day when the plant is transpiring most rapidly. You can even see that the weight change is moderate in the morning and in the evening and is greater during the middle of the day. As the plant/substrate/pot/tensiometer setup is consistent (photo pg. 31), any change in mass is attributed to evapotranspiration. Figure 3 shows the tension measured by tensiometers during the same dry-down cycle. Notice that tension increases during the day and recovers during the night, perhaps because of water redistribution within the substrate. Also, notice that tension increases more and more dramatically as the dry-down cycle progresses. To determine the total volume of a pot, we lined the inside of the pot with a plastic bag and filled it with water. We weighed the pot filled with water and subtracted the weight of the empty pot and bag to get the weight of water. Then we converted the weight of water to volume using the water density. By dividing the volume of water held by the substrate by the total pot volume, we obtained the volumetric water content, that is plotted on the y-axis in Figure 4. The x-axis shows the tension measured by the tensiometers corresponding to the volumetric water content of the substrate at the same time.
The bottom line
Knowledge of the moisture-retention curve of each of your substrates and understanding of “easily available water” can help manage your irrigation more efficiently. The same substrate may also change depending on the supplier or lot shipped by a supplier. Please contact us and we will be happy to measure moisture-retention curves and available water for your substrate.
Get curated news on YOUR industry.
Enter your email to receive our newsletters.
Explore the March 2023 Issue
Check out more from this issue and find your next story to read.
Latest from Nursery Management
- [WATCH] Winter is coming...but spring will bring disease
- Sam Hoadley talks about Mt. Cuba Center's latest evaluation of Solidago sp. for the Mid-Atlantic region
- Prices & Market Segments
- Countdown to shutdown
- All in the family
- From growing plants to growing people
- Weed Control Report
- Advocacy in action